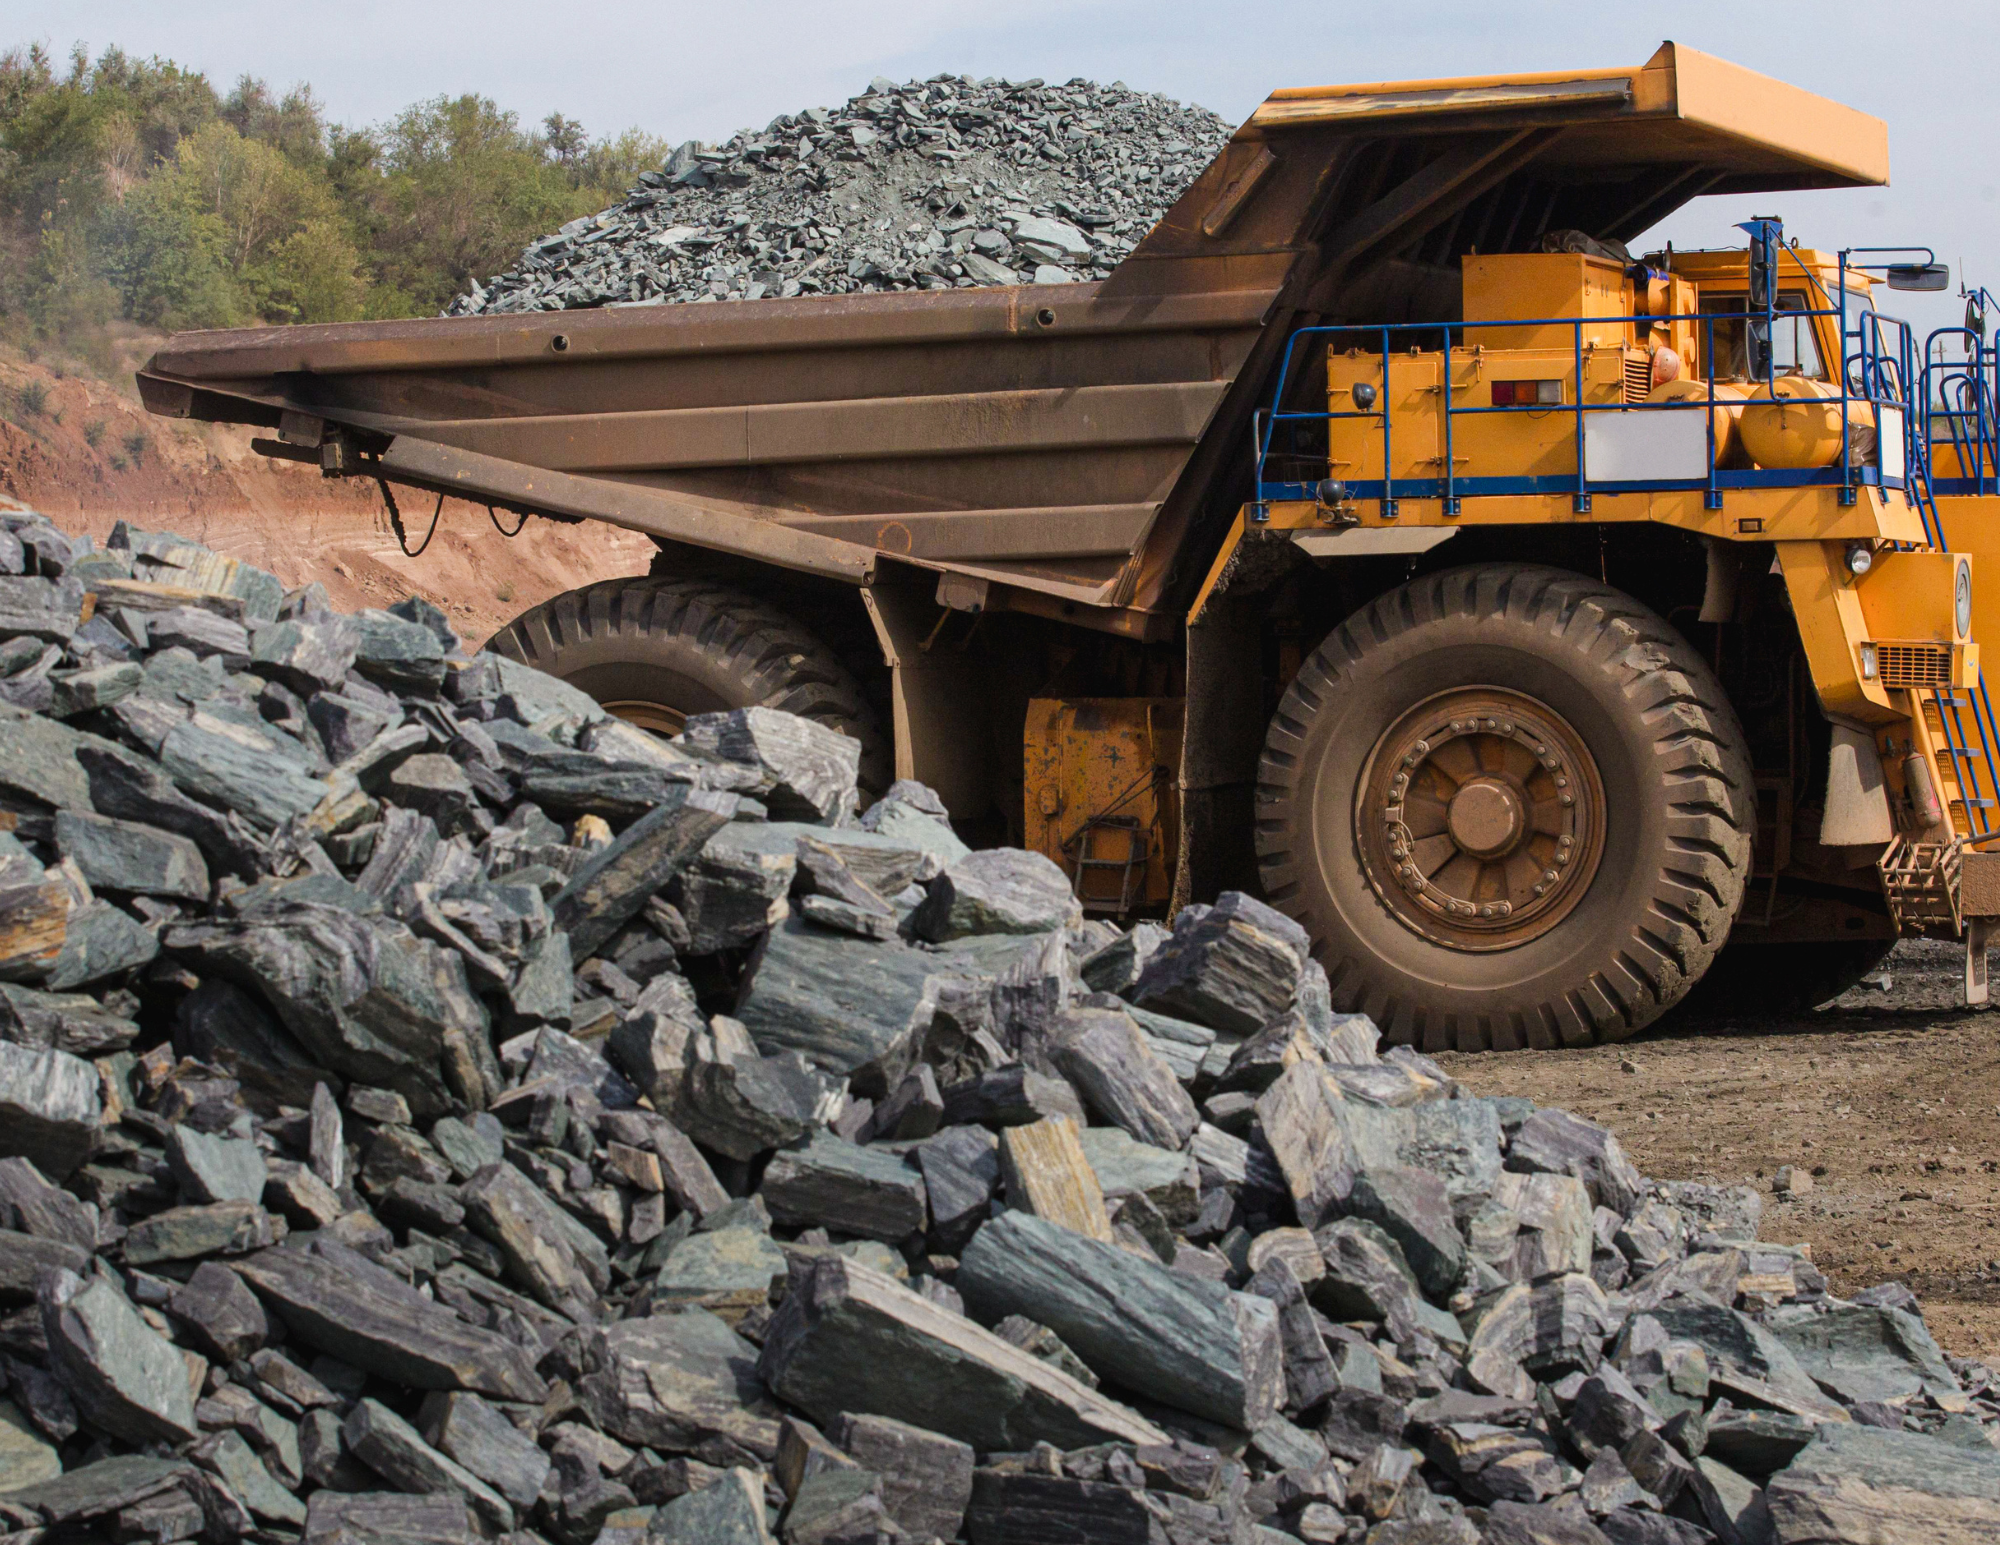
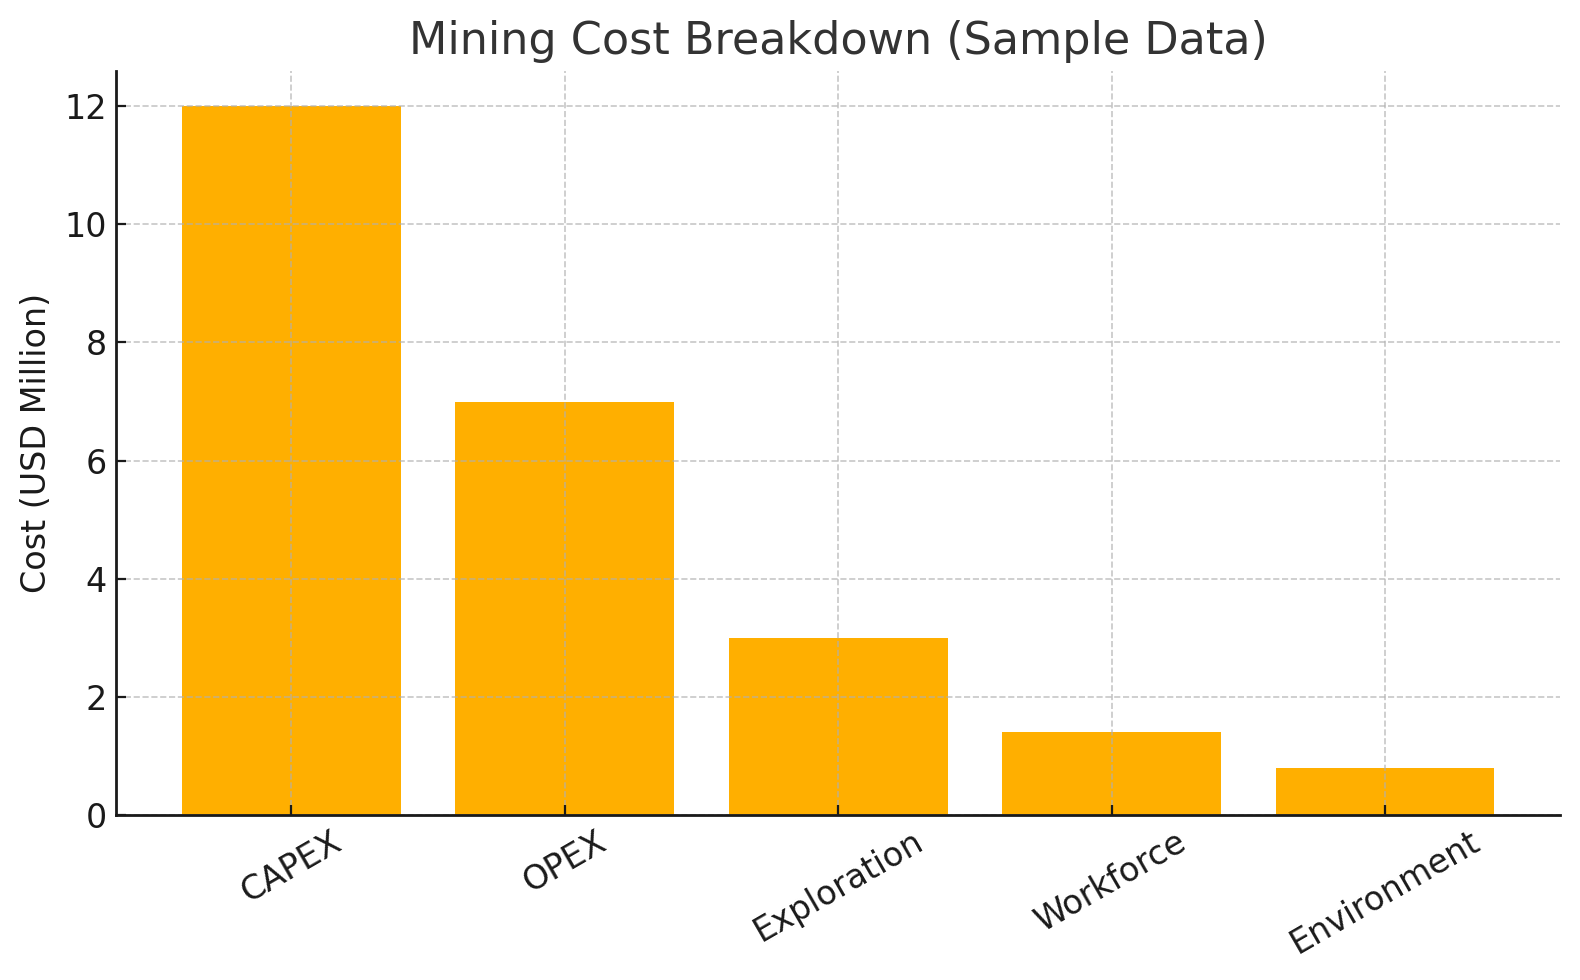
Our mining cost structure includes capital investment, operational expenses, exploration activities, workforce deployment, and environmental compliance. This breakdown helps ensure transparent financial planning and efficient resource allocation across all project stages
Cost Breakdown (CAPEX vs OPEX)
Category
Cost (USD Million)
CAPEX (Setup Cost)
12
OPEX (Operational Cost)
7
Exploration Cost
3
Workforce & Training
1.4
Environmental Compliance
0.8
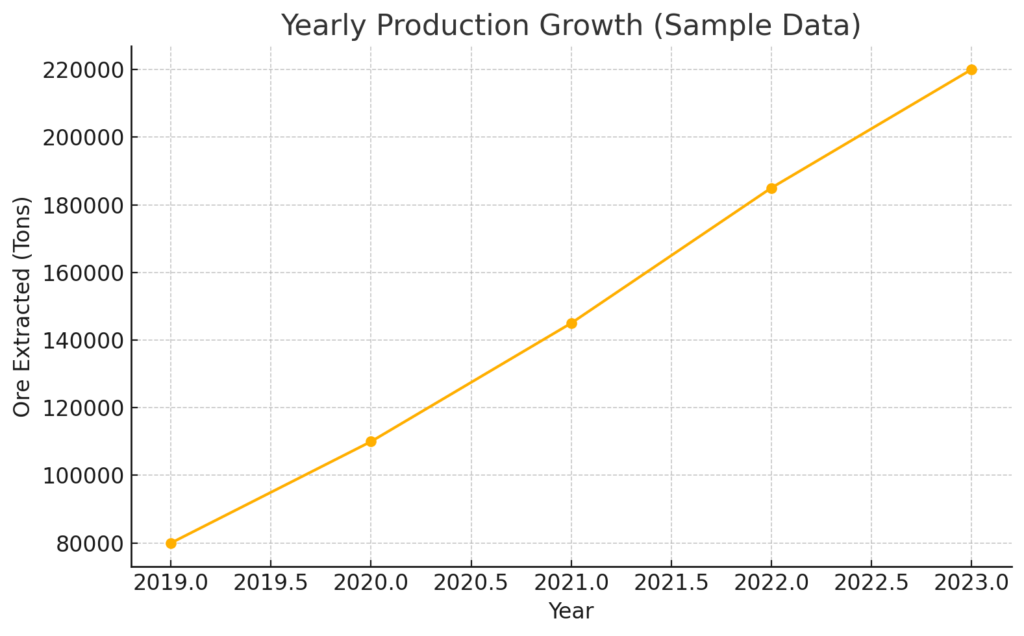
Production Growth
Our production growth reflects steady improvements in extraction efficiency, resource management, and operational planning. Each year shows a consistent increase in ore output, demonstrating strong project performance and expanding operational capacity.
Yearly Production Growth
Year
Ore Extracted (in Tons)
2019
80,000
2020
1,10,000
2021
1,45,000
2022
1,85,000
2023
2,20,000
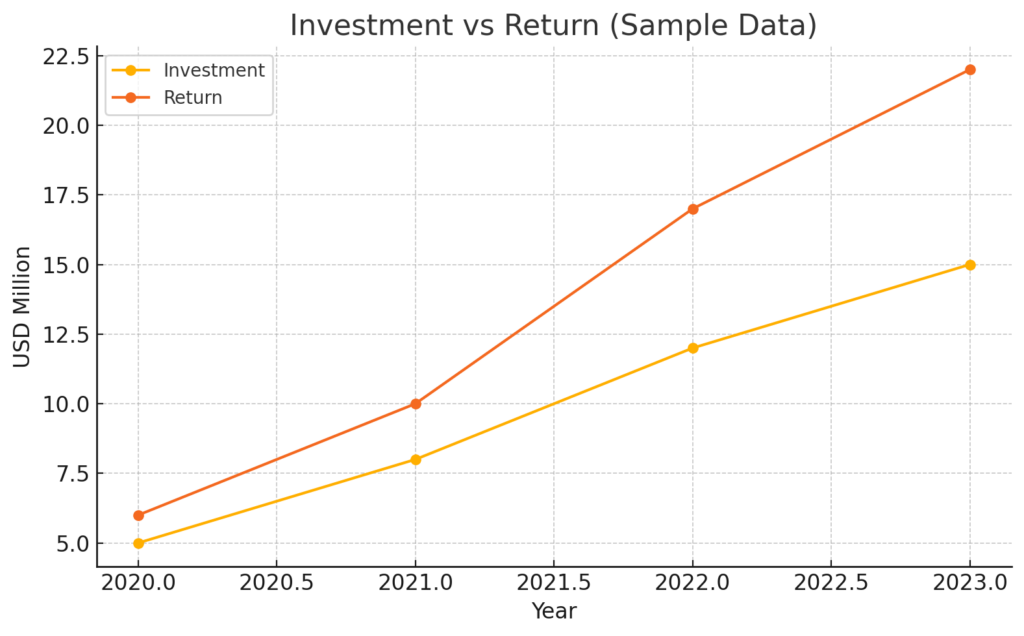
Investment vs Return (ROI)
Our investment-to-return analysis demonstrates strong financial performance, with returns consistently growing faster than the invested capital. This positive ROI trend reflects effective resource utilization and sustainable project profitability.
Investment vs Return (ROI Trend)
Year
Investment ($M)
Return ($M)
2020
5
6
2021
8
10
2022
12
17
2023
15
22
GH Mining focuses on long-term, responsible growth to deliver superior shareholder returns. We develop high-quality ore bodies into efficient, long-life operations in West Africa. Our mining and processing of minerals meet vital consumer needs, improve living standards, and are conducted safely, responsibly, and sustainably.